


How smart meter data can inform regulators and lead to smarter impact assessments
With fairness high up the agenda of regulators, Ofgem has been exploring how it can best capture the distributional effects of its policies. Smart meter consumption data can help make these assessments more useful. However, making sense of the vast amount of data requires both machine- learning techniques and careful judgment.
Regulators want to know how policies will affect different groups
Over the last few years, regulators and governments have been increasingly concerned about the distributional impact of their policies. Last year we published a series of articles about the what “fairness” might mean for different sectors.
Given this focus, Ofgem, the British energy regulator, needs to take into account how future policies will affect different types of customers. In May Ofgem consulted on a framework for these types of evaluations. It proposes to assess the impact of policies on a series of customer groups. These include users it is statutorily obliged to protect, such as those of pensionable age, as well as 13 customer “archetypes” based on sociodemographic and behavioural characteristics.
One factor that distinguishes electricity customers from one another is the time of day when they use it. Although most households currently pay the same for their power no matter when they consume it, time-of-use tariffs (where the amount paid changes over the year or the day) may become more widely available in future. Policies that affect these prices could therefore have a very different impact on customers depending on when they consume electricity.
Ofgem’s framework envisages adding to its archetypes consumption profile data showing when power is used. But, as we show in this article, standard consumer archetypes do not map neatly to distinct patterns of usage. In cases where the distributional impact of a policy is influenced by when electricity is consumed, these archetypes may work best alongside a classification based on the profiles of consumption themselves. As we explain, clustering techniques provide a way of transforming a huge dataset of customer profiles into an intuitive classification.
Clustering helps make sense of the wealth of load profile data
Our analysis uses data gathered as part of Northern PowerGrid’s Customer-Led Network Revolution (CLNR) project. Among the many datasets made available by this project is one showing anonymised half-hourly electricity consumption for around 9,000 households. It also includes archetypes taken from Experian’s Mosaic system, one of the most commonly used customer classification methods. These archetypes differ from the ones Ofgem uses (there is no consumption dataset available that includes Ofgem’s archetypes), but they follow the same principle, grouping together customers with similar sociodemographic characteristics.
For a single year, a customer will have 17,520 datapoints, describing each half-hour of the year. This adds up to over 150m datapoints just in this single dataset – far too many to make sense of. What is needed is a way to reduce the complexity of the data, classifying each customer in a way that distils the essence of their consumption profile while removing much of the detail.
We have used a clustering algorithm to do this. Clustering is an example of an “unsupervised machine-learning” technique, whereby an algorithm sorts a dataset into categories of similar observations, without being told ahead of time what those categories should be. The box below illustrates – in a very simplified form – what we have done.
How have we clustered profiles?
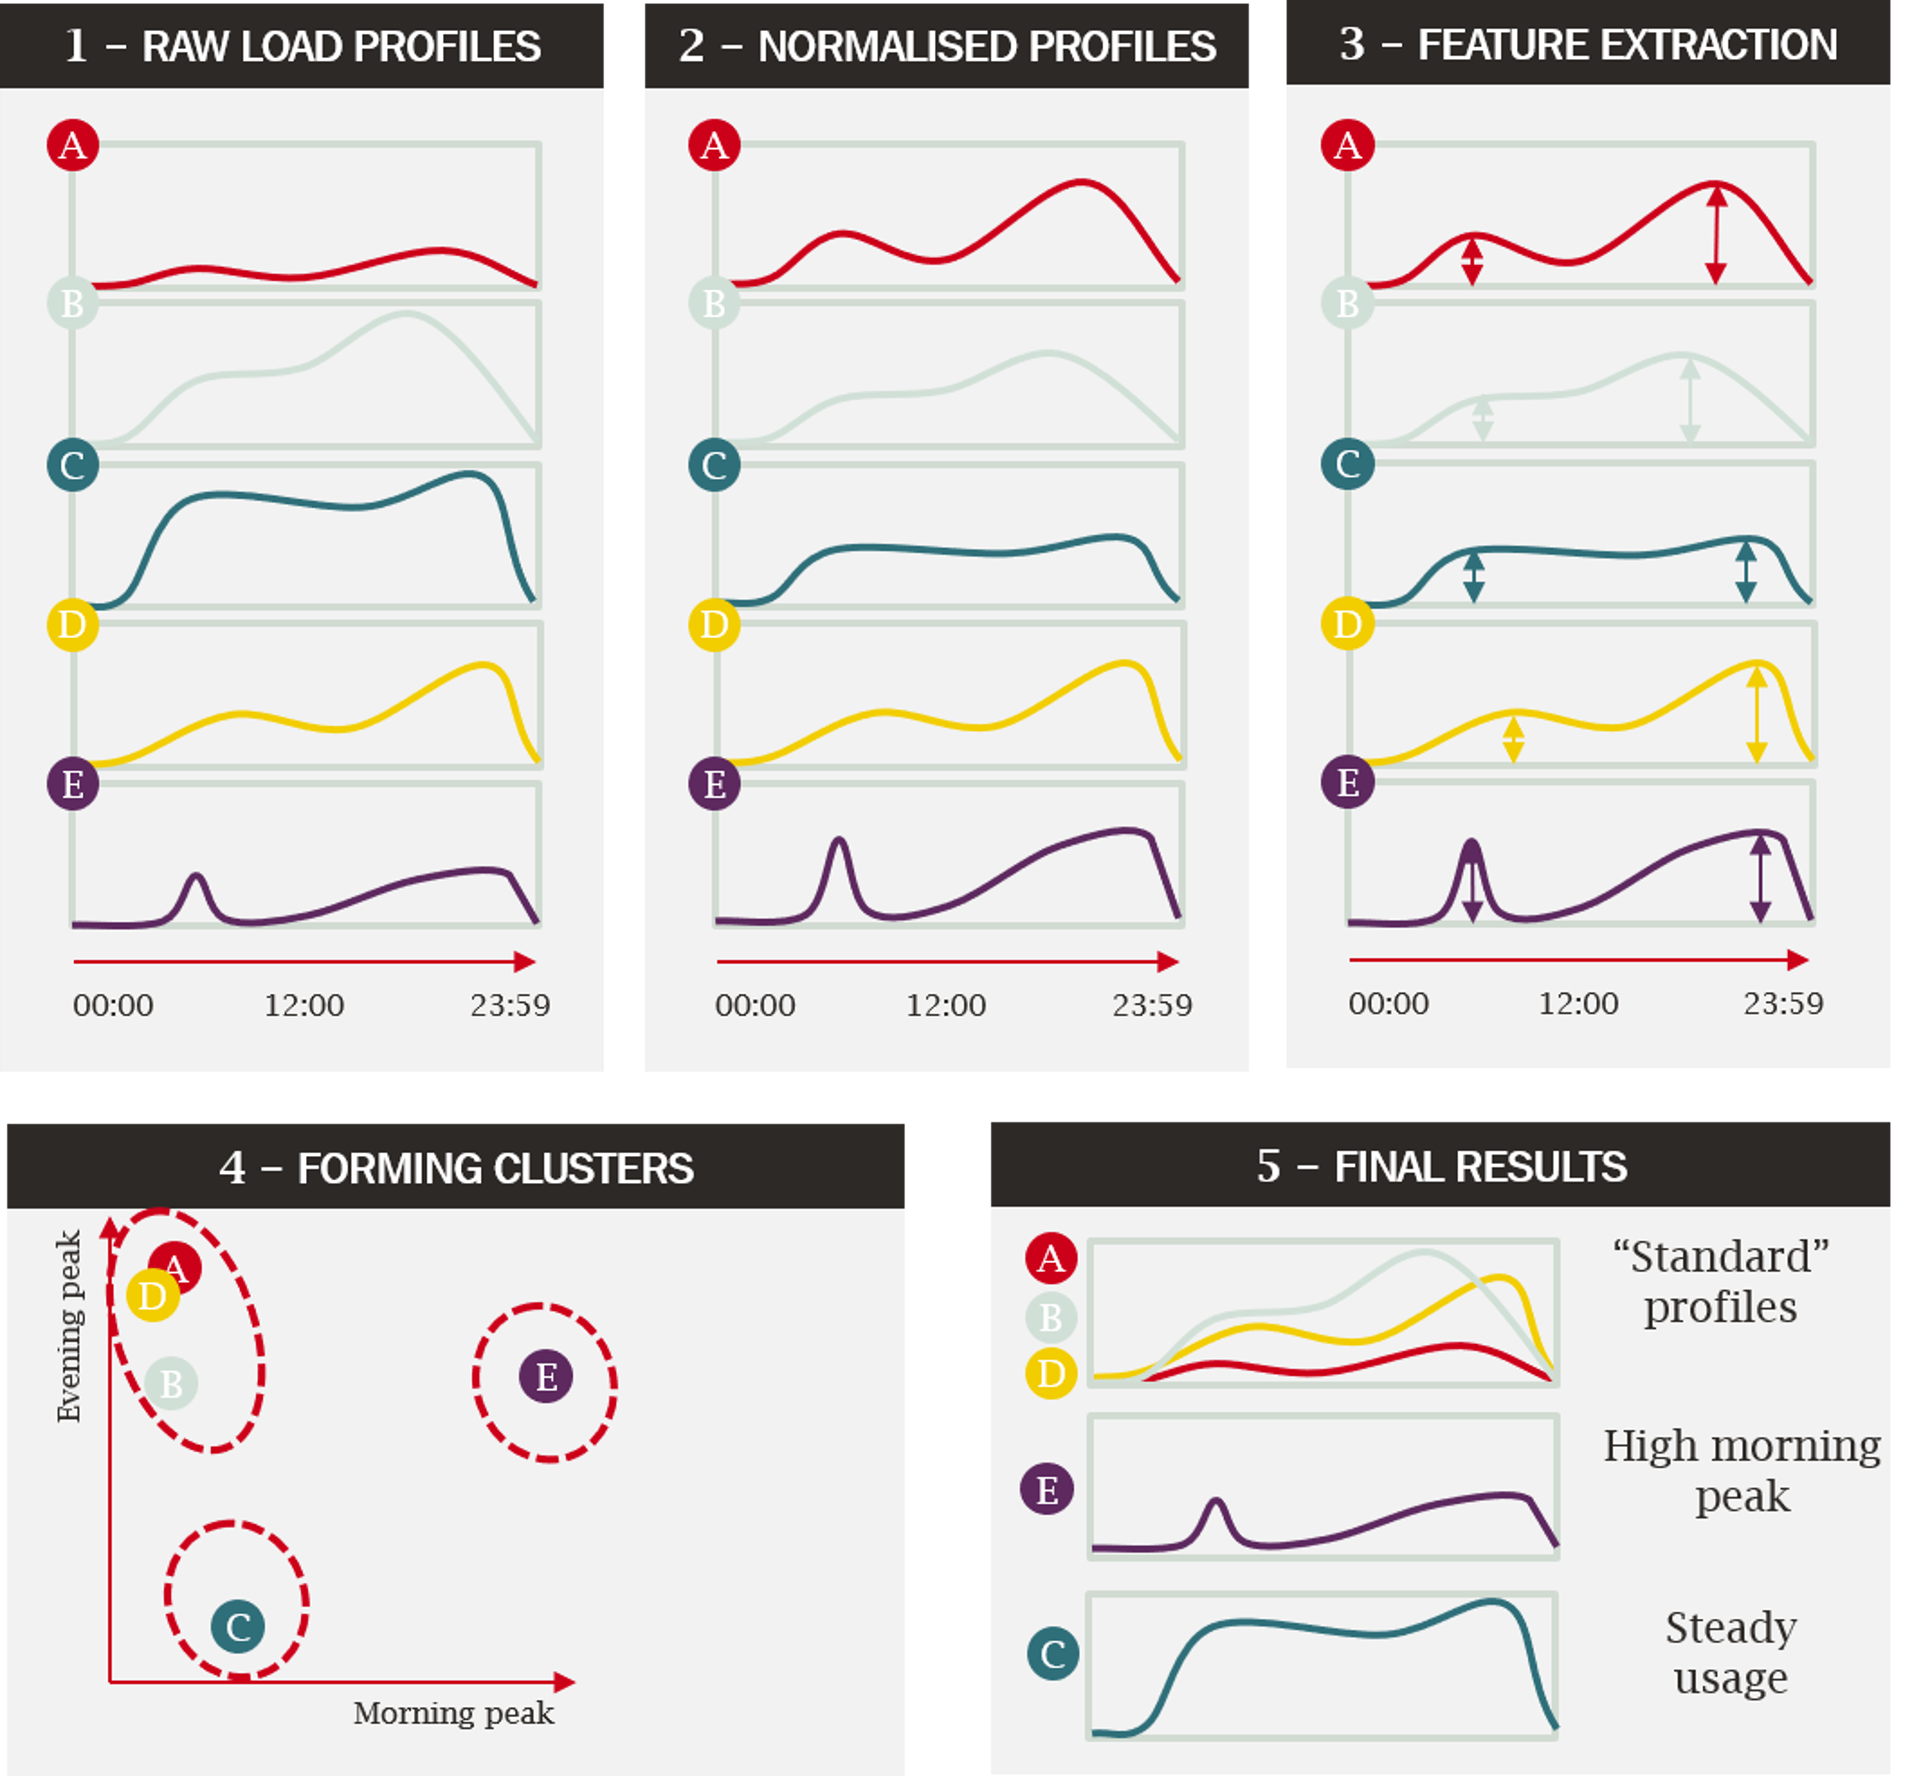
- We started with the raw data. Here, we have illustrated a day’s worth of data for five customers (in reality we had a year of data for almost 9,000 customers). The height of the line shows the amount of electricity being consumed at each point in the day.
- Whether a time-of-use tariff makes someone better or worse off will depend on the relative pattern of consumption (e.g. between the afternoon and the evening). The absolute level of consumption is less relevant. We have therefore normalised the profiles so they all have the same total energy consumption.
- At this point, each customer is still described by a datapoint for each half-hour, which is far too much detail. A process of feature extraction is needed to get to the “essence” of each customer. In the illustration, we have shown a simple method (our analysis is more complex) where we have defined each customer by the height of the morning and evening peak.
- Now that each user is defined by a small number of values, we can find which groups of customers resemble each other. In this example we have done so by eye – there is clearly a cluster of three similar customers (A, B, and D), while the other two (C and E) form their own distinct clusters. For our analysis we used a technique that can automatically form these clusters.
Looking at the final clusters in the illustration, we can see that they describe three intuitive types of customers. Those with “standard” consumption profiles (with a smaller morning peak and larger evening peak), those with a particularly high morning peak and those with very steady consumption through the day. This shows how this type of analysis can boil a large dataset down to a manageable number of clusters from which to draw conclusions.
From the description above, you will see that it is not simply a matter of feeding a large amount of raw data into a machine-learning algorithm that can “do the rest” without human intervention. The algorithm can base its decisions only on the data that is given to it, so the job of the researcher is to use their knowledge of the wider context to guide the algorithm to a better result.
For example, as we knew that what matters for a distributional assessment is a customer’s relative use of electricity over the day rather than their absolute consumption, we applied a specific type of normalisation. If we left the process to the computer and omitted this step, the final choice of clusters would probably have been heavily determined by overall energy usage, which is irrelevant.
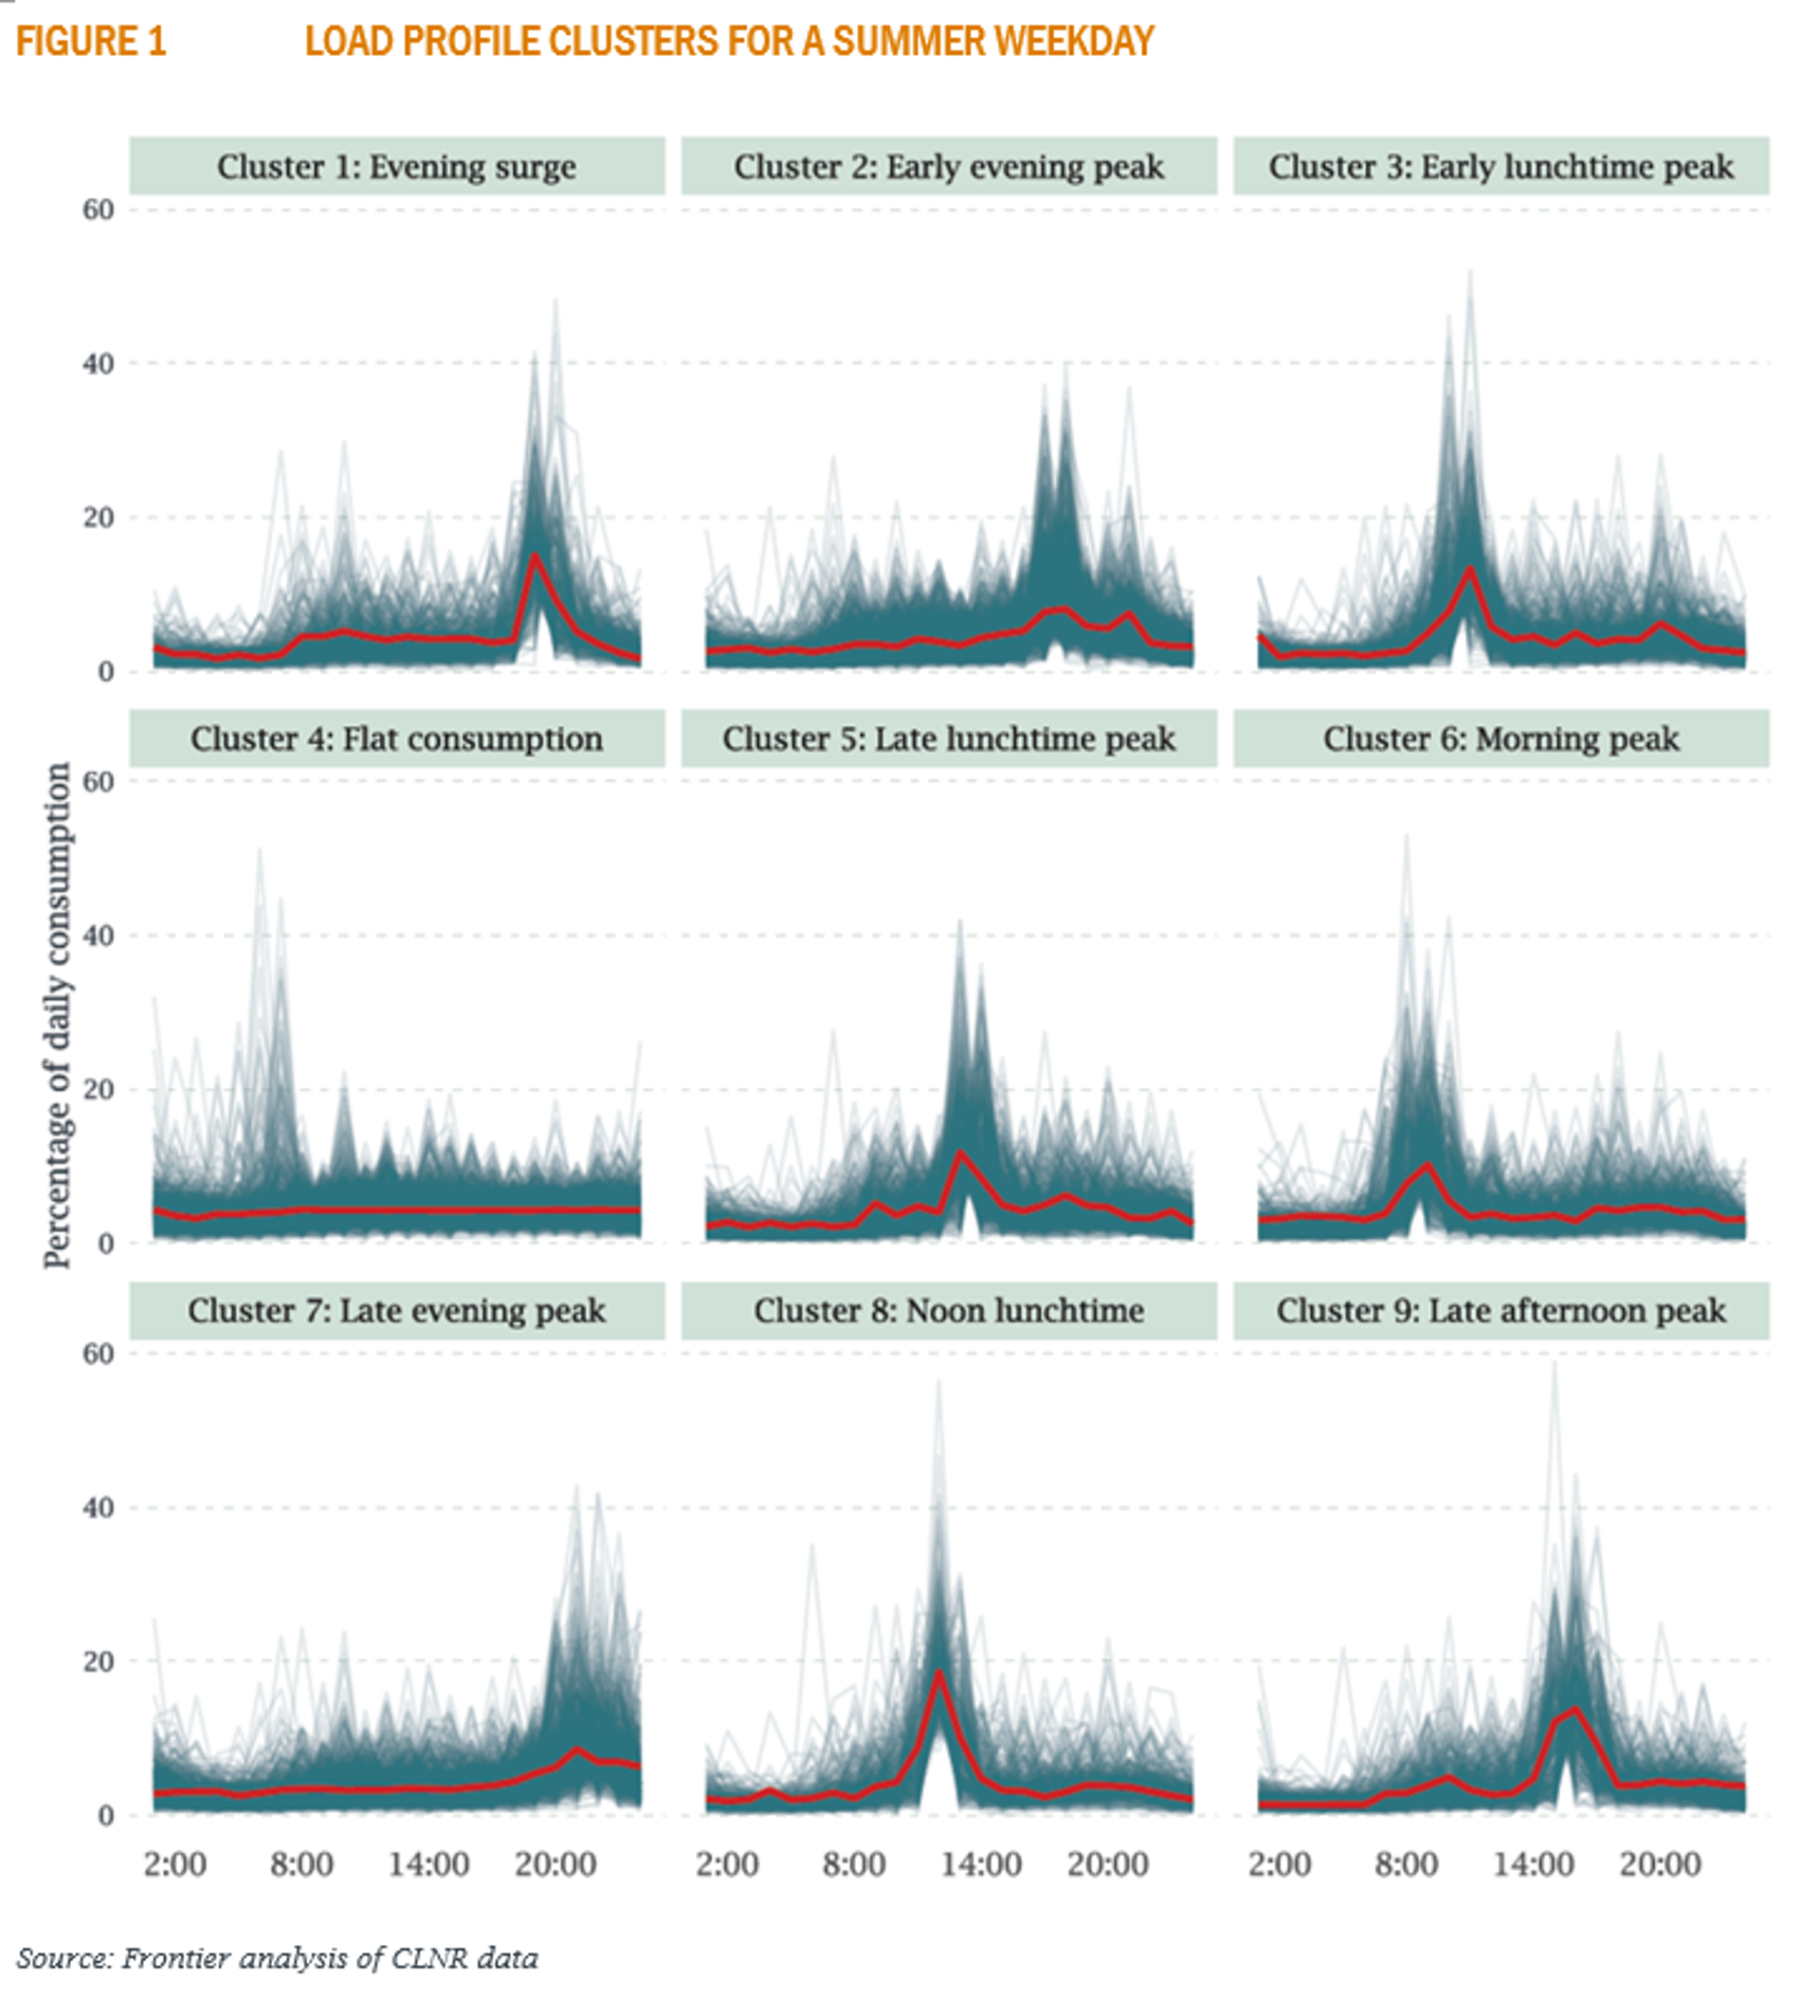
We have carried out this type of analysis on the full CLNR dataset and produced nine clusters, each with their own pattern of electricity usage. For example, some clusters show a significant spike in consumption at midday (perhaps people using an electric cooker for lunch) while others peak in the evening. Figure 1 illustrates each cluster. The red line shows the typical load profile of customers in this cluster. The blue lines show the load profiles of all the other customers that are in the same cluster.
We have created a tool that lets you explore how your own consumption compares to these clusters.
Standard archetypes do not correlate strongly with consumption profiles
Now we have these clusters, we can check how well correlated they are with the archetypes. Figure 2 shows the proportion of load profiles of each cluster within each of the Mosaic archetypes.
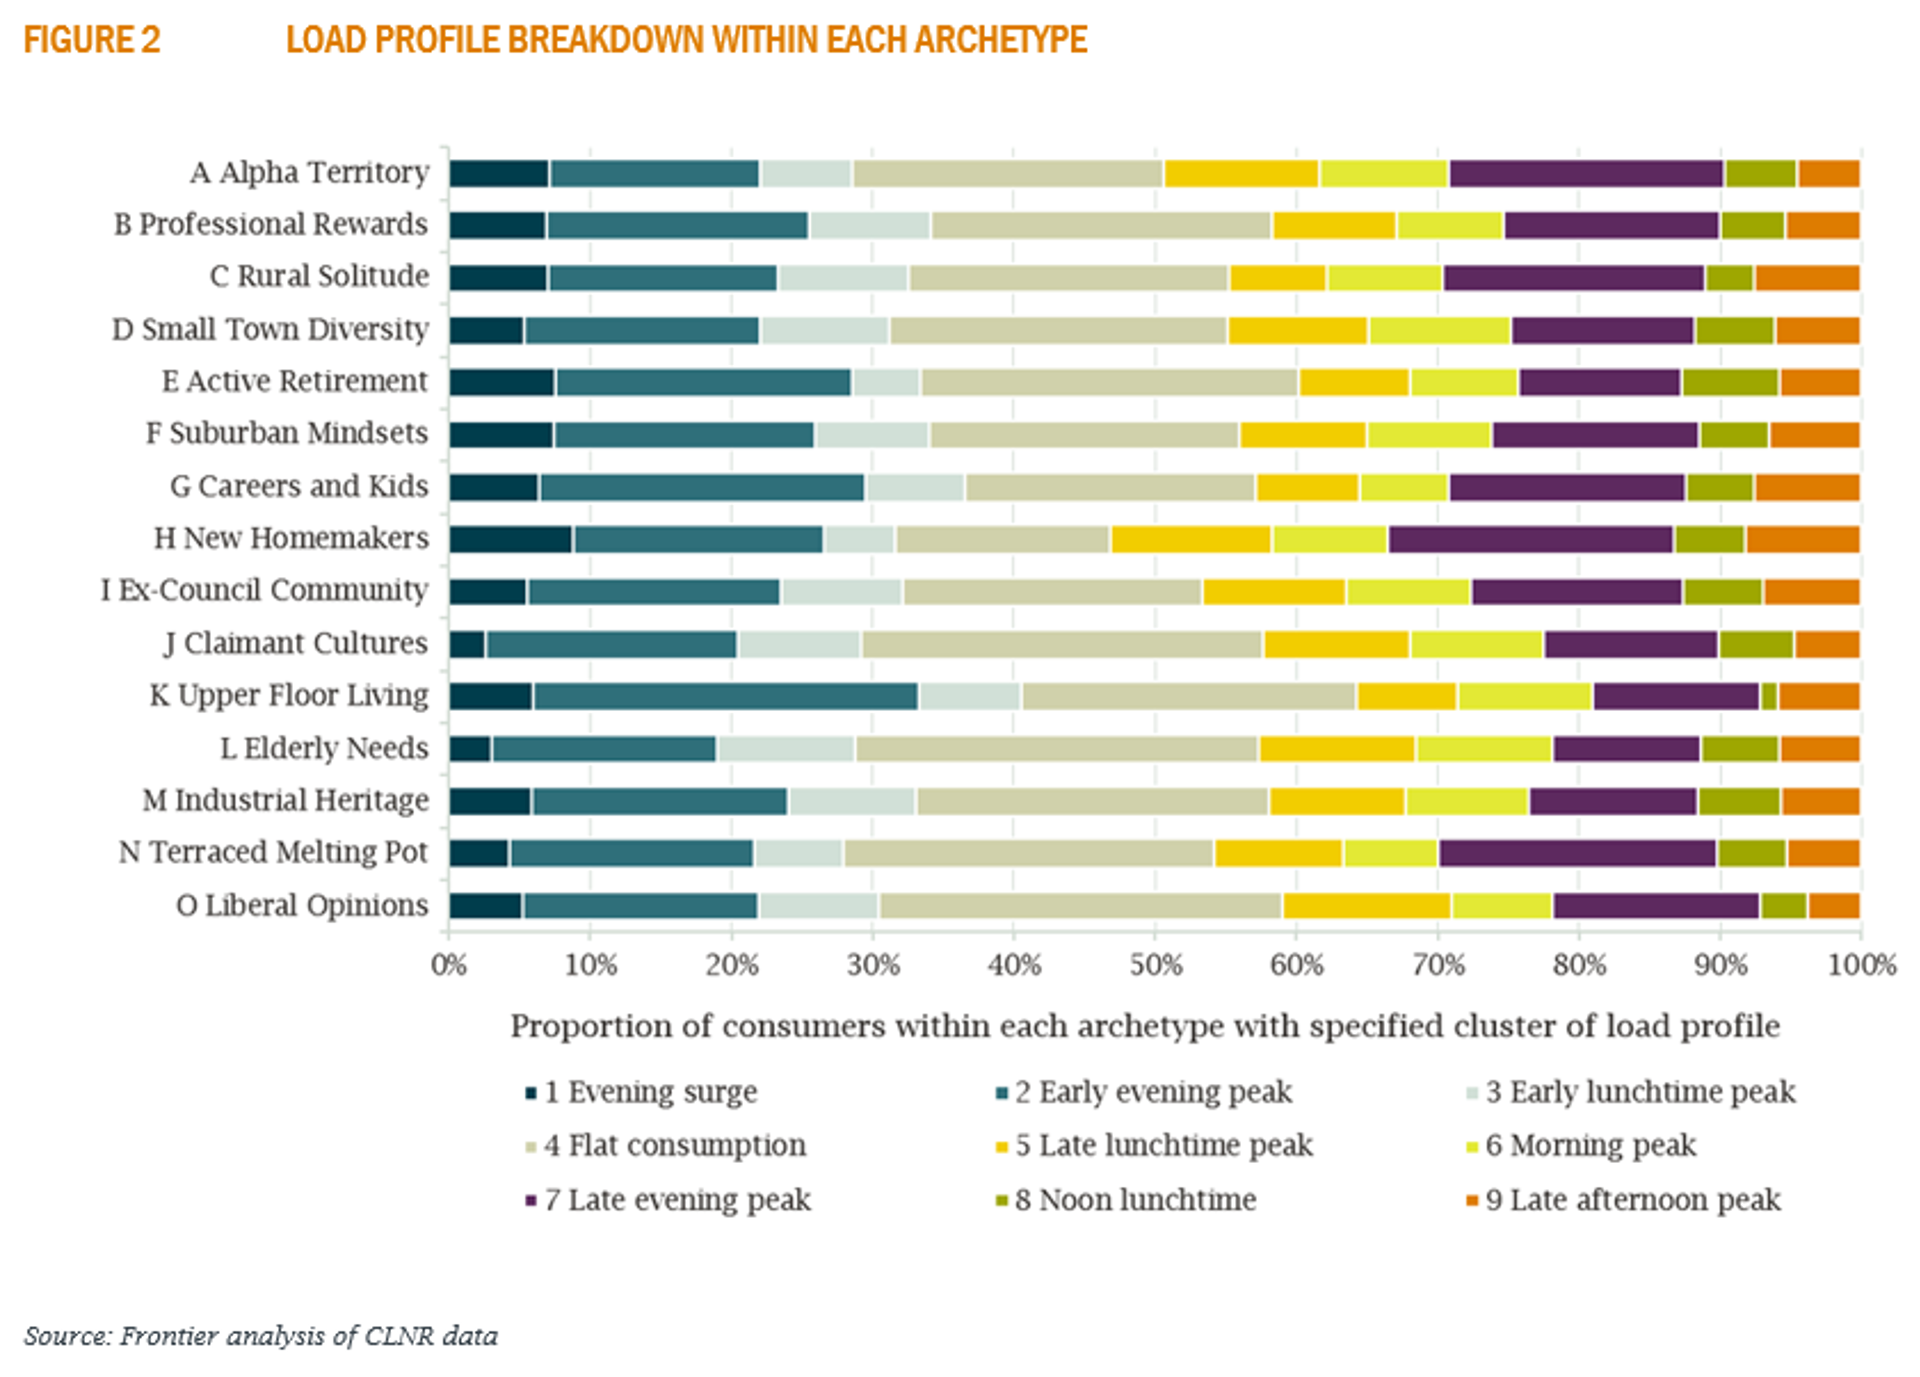
There is only a very weak correlation, and in general the customer archetypes are not a good predictor of consumption patterns. This is consistent with previous research, which has tended to show that while high-level demographic measures such as wealth may be correlated with total energy usage, they are not good predictors of consumption profiles. As you will have found in the interactive tool, electricity consumption is a reflection of highly individual patterns of behaviour, which will not always be a function of sociodemographic characteristics.
What does this mean for distributional analysis?
We have shown how general purpose archetypes are not well correlated with patterns of electricity usage. Ofgem’s archetypes are more directly linked to patterns of energy consumption than the Mosaic groups and may therefore be somewhat more correlated with consumption profiles than the Mosaic archetypes seen here. However, given the sheer variety of customers covered by each archetype, this correlation is still likely to be very weak.
Having a consistent set of such archetypes is an invaluable tool for distributional analyses as they allow different policies to be compared on a like-for-like basis. However, for policies where the main distributional impacts depend on consumption patterns (e.g. time-of-use tariffs), additional tools will be required.
Techniques like clustering offer a way to build a set of “consumption profile archetypes” that could complement the standard sociodemographic archetypes. This type of analysis is potentially useful for identifying the distribution of winners and losers in terms of their consumption patterns – whether any adverse impacts of a policy are relatively mild, or if there pockets of customers for whom the effect will be much greater. However, a number of issues need to be borne in mind.
We need to understand who is in each cluster
A distributional analysis ideally needs to identify who these groups of customers are. The clustering analysis might tell us, for example, that a policy is disadvantageous for “people who use a lot of electricity on weekday lunchtimes”. But to assess this finding in its full context, we need to understand whether these customers are already disadvantaged or vulnerable in some way.
Access to data is needed
Carrying out this type of analysis requires access to a large dataset of representative smart meter data showing customers’ hour-by-hour consumption.
Given the sensitivity of such data, it is (rightly) subject to strict controls on who can access it and for what purposes. However, such restrictions may hinder regulators and governments from fully understanding the effects of their regulations.
Anonymised samples like the CLNR dataset can avoid some of the privacy concerns. But such samples may not be large enough to capture relatively unusual patterns of consumption which could still affect many tens or hundreds of thousands of people and might be important for the assessment of some policies. They may also fail to capture the richness of sociodemographic data needed to understand the types of customer within each cluster.
There may not be one type of clustering that works for all policies
As we have shown, a machine-learning approach such as clustering still requires the researcher to make decisions based on their knowledge of the overall context. One key decision involves the “feature extraction” step that streamlines a load profile with many thousands of observations into a manageable series of values. Much data is lost in this step, so the art of feature extraction lies in preserving the aspects of the consumption profile that are most relevant for the analysis being carried out.
Different policies may have different types of distributional effect. For some it could be the size of the peak that is more important; for others, the overall shape. So rather than one set of “fits all” clusters, it may be most appropriate to build the clusters with the policy in mind.
Authors

Alex advises on energy market issues with a focus on quantitative modelling and the transition to a zero-carbon system.
View profile
Since joining Frontier in 2019, Sumaiya has worked across several practices, and is currently involved in the Competition and Strategy sectors.
View profileExplore your electricity usage
We have built a tool that estimates what your electricity consumption may look like, and how it compares to the clusters we have produced.
Use the tool